Home > Practice > Data Interpretation > Pie Chart > Miscellaneous
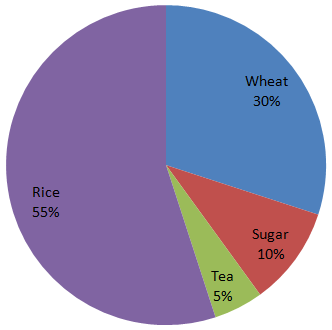
1. In the given pie- chart , the comparative study of the production of rice, wheat, sugar and tea of a country is given. Study the pie- chart and answer the following questions.

From this diagram the ratio of sum of wheat and sugar production to difference in production of rice and tea is:

From this diagram the ratio of sum of wheat and sugar production to difference in production of rice and tea is:
Solution:
| (Wheat + Sugar) | : | (Rice - Tea) |
| (30 + 10) | : | (55 - 5) |
| 40 | : | 50 |
| 4 | : | 5 |