Home > Practice > Data Interpretation > Pie Chart > Miscellaneous
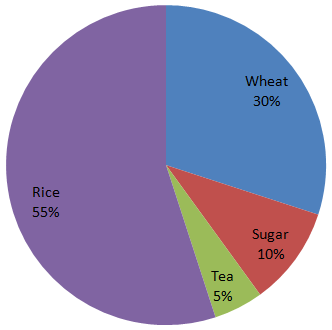
1. In the given pie- chart , the comparative study of the production of rice, wheat, sugar and tea of a country is given. Study the pie- chart and answer the following questions.

The production of rice and tea is more/ greater than production of wheat by-
Wheat = 30° = × 100 = 100%

The production of rice and tea is more/ greater than production of wheat by-
Solution:
Rice + Tea = 55% + 5% = 60%Wheat = 30° = × 100 = 100%