Home > Practice > Data Interpretation > Pie Chart > Miscellaneous
1. Refer to the pie-chart and answer the given questions.
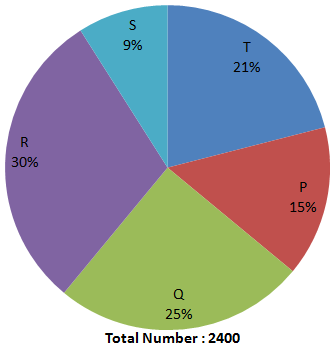
Distribution of total number of Dell Laptops Sold by 5 Stores.

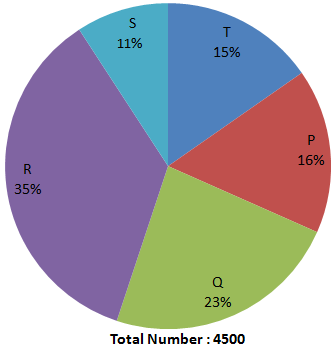
Distribution of number of Laptops (both Dell and Lenovo) Sold by 5 Stores in 2011.

Number of Dell laptops sold by store T is what percent more than the number of laptops sold by store P?
Number of Laptops sold by store P
Required Percentage
Distribution of total number of Dell Laptops Sold by 5 Stores.

Distribution of number of Laptops (both Dell and Lenovo) Sold by 5 Stores in 2011.

Number of Dell laptops sold by store T is what percent more than the number of laptops sold by store P?
Solution:
Number of Dell laptops sold by store TNumber of Laptops sold by store P
Required Percentage