Home > Practice > Data Interpretation > Pie Chart > Miscellaneous
1. Refer to the pie-chart and the table carefully and answer the given question.
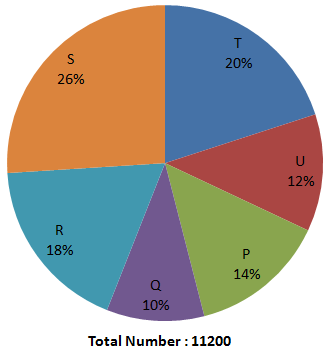
Distribution of total number of cellular phones (both Nokia and Samsung) sold by six stores in October.

Ratio of the number of Nokia cellular phones sold to that of Samsung cellular phone sold.
The total number of cellular phones (both Nokia and Samsung) sold by store Q increased by 15% from October to November and the same of cellular phones sold by store T increased by 5% from October to November. What was the total number of cellular phones sold by store Q and T together in November?
Number of cellular phones (both Nokia and Samsung) sold by store Q in October
= 11200 ×
= 1120
∵ Number of cellular phones (both Nokia and Samsung) sold by store Q in November
= 1120 ×
= 1288
Number of cellular phones (both Nokia and Samsung) sold by store T in October
= 11200 ×
= 2240
∵ Number of cellular phones (both Nokia and Samsung) sold by store T in November
= 2240 ×
= 2352
∵ Total number of cellular phones (both Nokia and Samsung) sold by Q and T together in November
= 1288 + 2352
= 3640
Distribution of total number of cellular phones (both Nokia and Samsung) sold by six stores in October.

Ratio of the number of Nokia cellular phones sold to that of Samsung cellular phone sold.
| Store | Ratio |
| P | 4 : 3 |
| Q | 3 : 1 |
| R | 5 : 4 |
| S | 7 : 6 |
| T | 1 : 4 |
| U | 11 : 10 |
The total number of cellular phones (both Nokia and Samsung) sold by store Q increased by 15% from October to November and the same of cellular phones sold by store T increased by 5% from October to November. What was the total number of cellular phones sold by store Q and T together in November?
Solution:
| Store | Nokia Cellular Phones | Samsung Cellular Phones | Total Number of Cellular Phones |
| P | 896 | 672 | 1568 |
| Q | 840 | 280 | 1120 |
| R | 1120 | 896 | 2016 |
| S | 1568 | 1344 | 2912 |
| T | 448 | 1792 | 2240 |
| U | 704 | 640 | 1344 |
Number of cellular phones (both Nokia and Samsung) sold by store Q in October
= 11200 ×
= 1120
∵ Number of cellular phones (both Nokia and Samsung) sold by store Q in November
= 1120 ×
= 1288
Number of cellular phones (both Nokia and Samsung) sold by store T in October
= 11200 ×
= 2240
∵ Number of cellular phones (both Nokia and Samsung) sold by store T in November
= 2240 ×
= 2352
∵ Total number of cellular phones (both Nokia and Samsung) sold by Q and T together in November
= 1288 + 2352
= 3640