Home > Practice > Data Interpretation > Bar Graphs > Miscellaneous
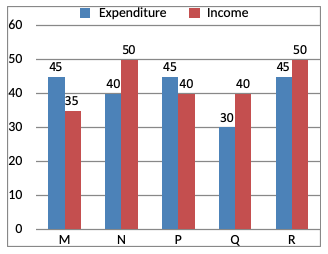
1. Study the bar chart given below and answer the following questions:
Income and Expenditure (in Rs. crore) in 2001 of five companies

For company R if the expenditure had increased by 20% in the year 2001 from the year 2000 and the company had earned profit of 10% in 2000, the company’s income in 2000 was (in Rs. crore).
Let the income of company in 2000 be Rs. crores
Income and Expenditure (in Rs. crore) in 2001 of five companies

For company R if the expenditure had increased by 20% in the year 2001 from the year 2000 and the company had earned profit of 10% in 2000, the company’s income in 2000 was (in Rs. crore).
Solution:
Expenditure of company R in 2000Let the income of company in 2000 be Rs. crores