Home > Practice > Data Interpretation > Bar Graphs > Miscellaneous
1. Study the bar diagram and answer the following questions.
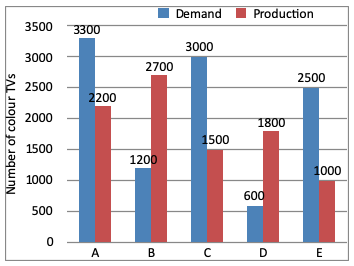
Demand and production of colour TV of five companies A, B, C, D, and E.

The ratio of average demand to average production of companies B and D is:
= 900 : 2250
= 2 : 5
Demand and production of colour TV of five companies A, B, C, D, and E.

The ratio of average demand to average production of companies B and D is:
Solution:
Required ratio= 900 : 2250
= 2 : 5