Home > Practice > Data Interpretation > Bar Graphs > Miscellaneous
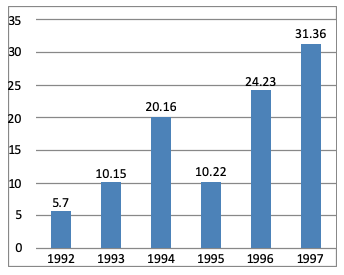
1. Study the bar diagram carefully and answer the questions. The bar diagram shows the trends of foreign direct investment (FDI) into India from all over the World (in Rs. crores).

The difference between FDI of 1997 and 1996.
= 31.36 - 24.23
= 7.13

The difference between FDI of 1997 and 1996.
Solution:
Absolute difference in FDI to India between 1996 and 1997= 31.36 - 24.23
= 7.13