Home > Practice > Data Interpretation > Bar Graphs > Miscellaneous
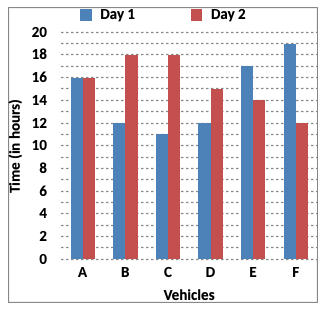
1. Study the following bar graph and the table carefully and answer the questions given below:
Time Taken (in hours) by 6 Vehicles on Two Different Days

Distance Covered (in km) by 6 Vehicles on Each Day
What was the difference between the speed of vehicles A on Day 1 and the speed of vehicles C on the same day ?
Difference between the speed of A on Day 1 and speed of C on Day 1
= (63 - 52) km/hr
= 11 km/hr
Time Taken (in hours) by 6 Vehicles on Two Different Days

Distance Covered (in km) by 6 Vehicles on Each Day
| Vehicles | Day 1 | Day 2 |
| A | 832 | 864 |
| B | 516 | 774 |
| C | 693 | 810 |
| D | 552 | 765 |
| E | 935 | 546 |
| F | 703 | 636 |
What was the difference between the speed of vehicles A on Day 1 and the speed of vehicles C on the same day ?
Solution:
Difference between the speed of A on Day 1 and speed of C on Day 1
= (63 - 52) km/hr
= 11 km/hr