Home > Practice > Data Interpretation > Bar Graphs > Miscellaneous
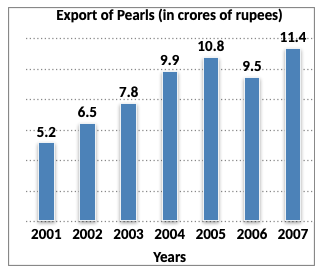
1. Study the following bar-graph carefully and answer the questions given below:

In which of the following pairs of years was the average export of pearls around Rs. 9 crores?

In which of the following pairs of years was the average export of pearls around Rs. 9 crores?
Solution: