Home > Practice > Data Interpretation > Bar Graphs > Miscellaneous
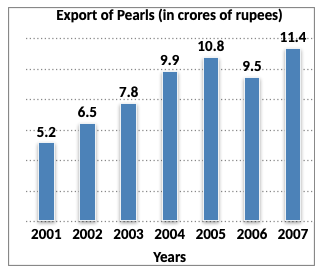
1. Study the following bar-graph carefully and answer the questions given below:

In which year was there maximum percentage increase in export of pearls to that in the previous year?
Clearly, the maximum increase was in 2004

In which year was there maximum percentage increase in export of pearls to that in the previous year?
Solution:
Clearly, the maximum increase was in 2004