Home > Practice > Data Interpretation > Bar Graphs > Miscellaneous
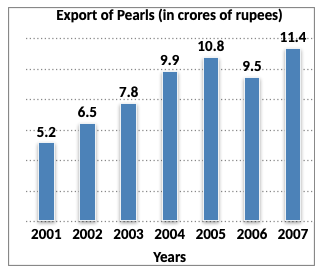
1. Study the following bar-graph carefully and answer the questions given below:

What was the percentage increase in export from 2006 to 2007 ?

What was the percentage increase in export from 2006 to 2007 ?
Solution:
Percentage increase in export from 2006 to 2007.