Home > Practice > Data Interpretation > Bar Graphs > Miscellaneous
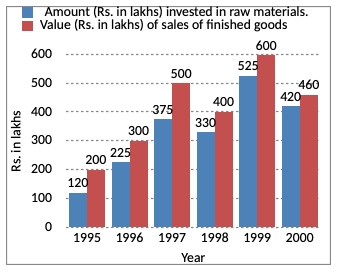
1. Study the following graph and answer the given questions.

In which year, there has been a maximum percentage increase in the amount invested in raw materials as compared to the previous year?
= × 100 = 87.5%
Percentage increase in year 1997
= × 100 = 67%

In which year, there has been a maximum percentage increase in the amount invested in raw materials as compared to the previous year?
Solution:
Percentage increase in year 1996= × 100 = 87.5%
Percentage increase in year 1997
= × 100 = 67%