Home > Practice > Data Interpretation > Bar Graphs > Miscellaneous
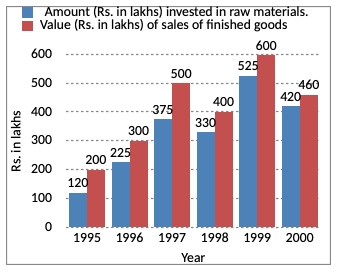
1. Study the following graph and answer the given questions.

What was the difference between the average amount invested in raw materials during the given period and the average value of sales of finished goods during this period?
(120 + 225 + 375 + 330 + 525 + 420)

What was the difference between the average amount invested in raw materials during the given period and the average value of sales of finished goods during this period?
Solution:
Average of total investment(120 + 225 + 375 + 330 + 525 + 420)