Home > Practice > Data Interpretation > Bar Graphs > Miscellaneous
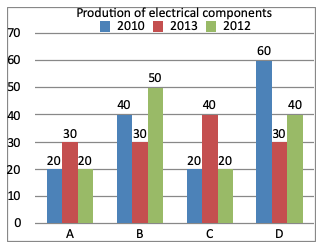
1. Study the following graph carefully and answer the given questions.

What is the ratio between average production by company B in three years to the average production by company C in three years?

What is the ratio between average production by company B in three years to the average production by company C in three years?
Solution: