Home > Practice > Data Interpretation > Bar Graphs > Miscellaneous
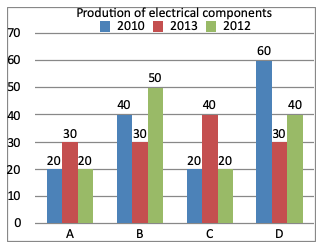
1. Study the following graph carefully and answer the given questions.

The total production of companies A and D in year 2010 is what percent of total production of four companies in the year 2012?
= 20 + 60
= 80
In 2012, A + B + C + D
= 20 + 50 + 20 + 40
= 130
= × 100
≈ 61%

The total production of companies A and D in year 2010 is what percent of total production of four companies in the year 2012?
Solution:
In 2010, A and D= 20 + 60
= 80
In 2012, A + B + C + D
= 20 + 50 + 20 + 40
= 130
= × 100
≈ 61%