Home > Practice > Data Interpretation > Bar Graphs > Miscellaneous
1. Study the following graph carefully and answer the questions that follow:
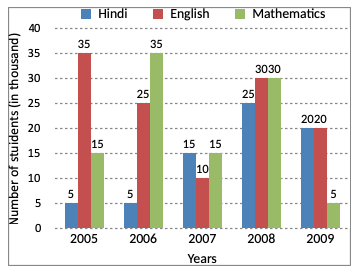
No. Of students (in thousands) who opted for Three Different Specializations during the Given Five Years in a University.

Out of the total number of students who opted for the given three subjects in the year 2009, 38% were girls. How many boys opted for Mathematics in the same year?
= 20000 + 20000 + 5000
= 45000
Number of girls = 38% of 45000
= 45000 ×
= 17100
Out of these, the number of boys who opted for Mathematics cannot be found.
No. Of students (in thousands) who opted for Three Different Specializations during the Given Five Years in a University.

Out of the total number of students who opted for the given three subjects in the year 2009, 38% were girls. How many boys opted for Mathematics in the same year?
Solution:
Number of students who opted for the given three subjects in the year 2009 is= 20000 + 20000 + 5000
= 45000
Number of girls = 38% of 45000
= 45000 ×
= 17100
Out of these, the number of boys who opted for Mathematics cannot be found.