Home > Practice > Data Interpretation > Bar Graphs > Miscellaneous
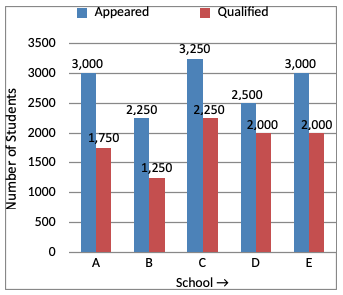
1. Study the following graph carefully and answer the questions given below:
Total Number of Students Appeared and Qualified from Various Schools at a Scholarship Exam.

The number of students appeared for the scholarship exam from School D is approximately what percent of the total number of students appeared for the exam from all the school together?
Total Number of Students Appeared and Qualified from Various Schools at a Scholarship Exam.

The number of students appeared for the scholarship exam from School D is approximately what percent of the total number of students appeared for the exam from all the school together?
Solution:
Required %