Home > Practice > Data Interpretation > Bar Graphs > Miscellaneous
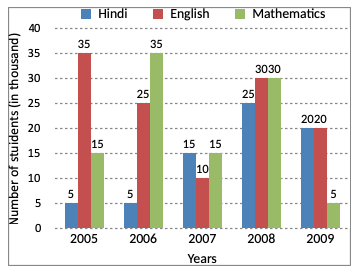
1. Study the following graph carefully and answer the questions that follow:
No. Of students (in thousands) who opted for Three Different Specializations during the Given Five Years in a University.

What is the total number of students who opted for Hindi and Mathematics in the years 2006, 2007 and 2009 together?
= {(5 + 35) + (15 + 15) + (20 + 5)} thousands
= 95000
No. Of students (in thousands) who opted for Three Different Specializations during the Given Five Years in a University.

What is the total number of students who opted for Hindi and Mathematics in the years 2006, 2007 and 2009 together?
Solution:
Number of students who opted Hindi and Mathematics in 2006, 2007 and 2009= {(5 + 35) + (15 + 15) + (20 + 5)} thousands
= 95000