Home > Practice > Data Interpretation > Bar Graphs > Miscellaneous
1. Study the following graph carefully and answer the questions that follow:
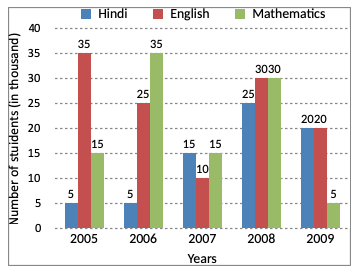
No. Of students (in thousands) who opted for Three Different Specializations during the Given Five Years in a University.

What is the ratio of the number of students who opted for English in the years 2006 and 2008 together to the number of students who opted for Hindi in the years 2005 and 2009 together?
= (25 + 30) : (5 + 20)
= 55 : 25
= 11 : 5
No. Of students (in thousands) who opted for Three Different Specializations during the Given Five Years in a University.

What is the ratio of the number of students who opted for English in the years 2006 and 2008 together to the number of students who opted for Hindi in the years 2005 and 2009 together?
Solution:
Ratio of the number who opted for English in 2006 and 2008 to the number who opted for Hindi in 2005 and 2009= (25 + 30) : (5 + 20)
= 55 : 25
= 11 : 5