Home > Practice > Data Interpretation > Bar Graphs > Miscellaneous
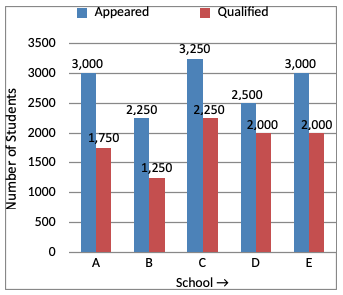
1. Study the following graph carefully and answer the questions given below:
Total Number of Students Appeared and Qualified from Various Schools at a Scholarship Exam.

What is the ratio of the number of students appeared to the number of students qualified at the scholarship exam from School C?
Total Number of Students Appeared and Qualified from Various Schools at a Scholarship Exam.

What is the ratio of the number of students appeared to the number of students qualified at the scholarship exam from School C?
Solution:
(Number of students appeared from C) : (Number of students qualified from C)