Home > Practice > Data Interpretation > Bar Graphs > Miscellaneous
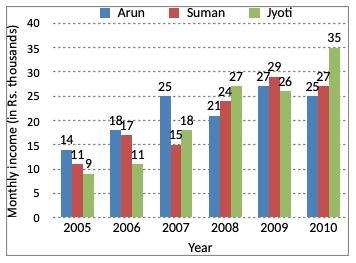
1. Study the following graph carefully to answer the questions that follow:
Monthly income (Rs. in thousands) of three different persons in six different years

In which year was the difference between Jyoti’s monthly income and Arun’s monthly income second highest ?
In 2006 difference between Jyoti's monthly income and Arun's monthly income second highest.
Monthly income (Rs. in thousands) of three different persons in six different years

In which year was the difference between Jyoti’s monthly income and Arun’s monthly income second highest ?
Solution:
| Year | Arun's income | Jyoti's income | Difference |
| 2005 | 14000 | 9000 | 5000 |
| 2006 | 18000 | 11000 | 7000 |
| 2007 | 23000 | 18000 | 5000 |
| 2008 | 21000 | 27000 | 6000 |
| 2009 | 27000 | 26000 | 1000 |
| 2010 | 25000 | 35000 | 10000 |
In 2006 difference between Jyoti's monthly income and Arun's monthly income second highest.