Home > Practice > Data Interpretation > Bar Graphs > Miscellaneous
1. study the following pie chart and bar diagram and answer the following questions.
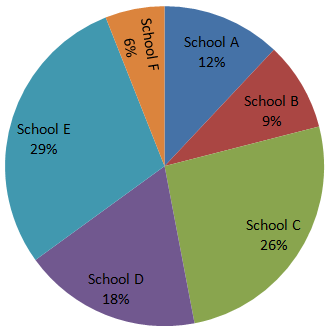
Percentage-wise Distribution of students in 6 Different Schools. Total number of students = 6000.

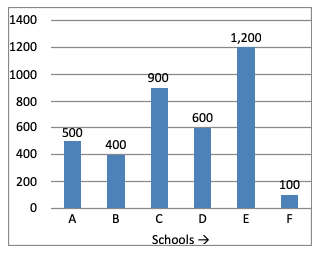
Number of Boys in Each School Out of 6000 Student

What is the ratio of the number of boys in school C, the number of girls in school B and the total number of students in school E?
Number of boys in:
A → 500
B → 400
C → 900
D → 600
E → 1200
F → 100
Number of girls in:
A → 720 - 500 = 220
B → 540 - 400 = 140
C → 1560 - 900 = 660
D → 1080 - 600 = 480
E → 1740 - 1200 = 540
F → 360 - 100 = 260
Required ratio
= 900 : 140 : 1740
= 90 : 14 : 174
= 45 : 7 : 87
Percentage-wise Distribution of students in 6 Different Schools. Total number of students = 6000.

Number of Boys in Each School Out of 6000 Student

What is the ratio of the number of boys in school C, the number of girls in school B and the total number of students in school E?
Solution:
Number of boys in:
A → 500
B → 400
C → 900
D → 600
E → 1200
F → 100
Number of girls in:
A → 720 - 500 = 220
B → 540 - 400 = 140
C → 1560 - 900 = 660
D → 1080 - 600 = 480
E → 1740 - 1200 = 540
F → 360 - 100 = 260
Required ratio
= 900 : 140 : 1740
= 90 : 14 : 174
= 45 : 7 : 87