Home > Practice > Data Interpretation > Bar Graphs > Miscellaneous
1. Study the following pie-chart and bar graph and answer the questions that follows:
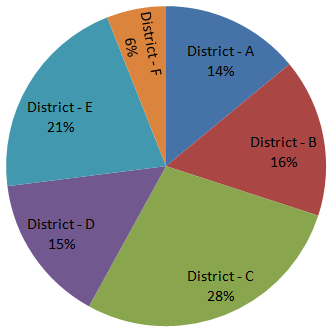
Percentage-wise distribution of Teachers in 6 Districts.

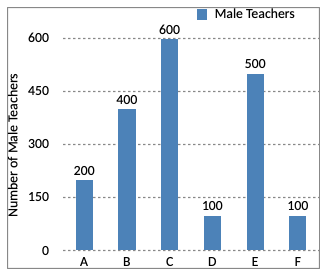
Number of males in each district out of 4500 Teachers.

In which district is the number of male teachers more than the number of female teachers?
Clearly, the number of male teachers is more than the number of female teachers in B and E.
Percentage-wise distribution of Teachers in 6 Districts.

Number of males in each district out of 4500 Teachers.

In which district is the number of male teachers more than the number of female teachers?
Solution:
| A | B | C | D | E | F | |
| Males | 200 | 400 | 600 | 100 | 500 | 100 |
| Females | 430 | 320 | 660 | 575 | 445 | 170 |
Clearly, the number of male teachers is more than the number of female teachers in B and E.