Home > Practice > Data Interpretation > Bar Graphs > Miscellaneous
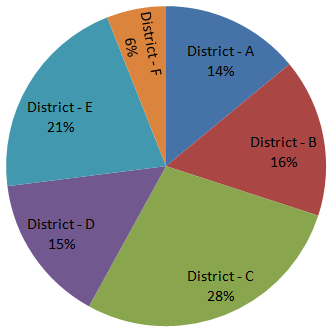
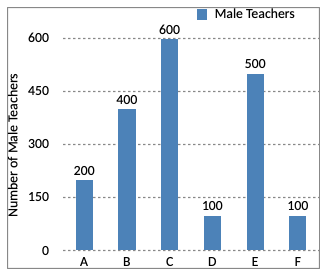
1. Study the following pie-chart and bar graph and answer the questions that follows:
Percentage-wise distribution of Teachers in 6 Districts.

Number of males in each district out of 4500 Teachers.

The number of female teachers in District D is approximately what percent of the total number of teachers (both male & female) in District A?
Female teacher in D = 575
Total number of teacher in A
= 200 + 430
= 630
∴ Required percentage
Percentage-wise distribution of Teachers in 6 Districts.

Number of males in each district out of 4500 Teachers.

The number of female teachers in District D is approximately what percent of the total number of teachers (both male & female) in District A?
Solution:
| A | B | C | D | E | F | |
| Males | 200 | 400 | 600 | 100 | 500 | 100 |
| Females | 430 | 320 | 660 | 575 | 445 | 170 |
Female teacher in D = 575
Total number of teacher in A
= 200 + 430
= 630
∴ Required percentage