Home > Practice > Data Interpretation > Pie Chart > Miscellaneous
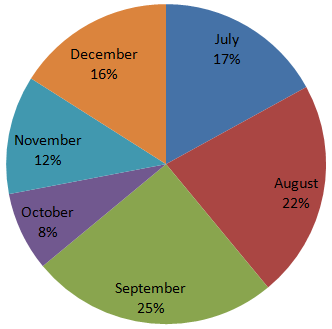
1. Study the following pie-chart and table carefully and answer the questions given below:
Percentage-wise Distribution of the Number of Mobile phones Sold by a Shopkeeper During Six Months. Ratio of mobile phones sold of Company A & Company B.

What is the ratio of the number of mobile phones sold of company B during July to those sold during December of the same company?
Number of mobile phones sold by B during December
Percentage-wise Distribution of the Number of Mobile phones Sold by a Shopkeeper During Six Months. Ratio of mobile phones sold of Company A & Company B.

| Total number if mobile phones sold = 45000 | |
| Month | Ratio (A : B) |
| July | 8 : 7 |
| August | 4 : 5 |
| September | 3 : 2 |
| October | 7 : 5 |
| November | 7 : 8 |
| December | 7 : 9 |
What is the ratio of the number of mobile phones sold of company B during July to those sold during December of the same company?
Solution:
Number of mobile phones sold by B during JulyNumber of mobile phones sold by B during December