Home > Practice > Data Interpretation > Pie Chart > Miscellaneous
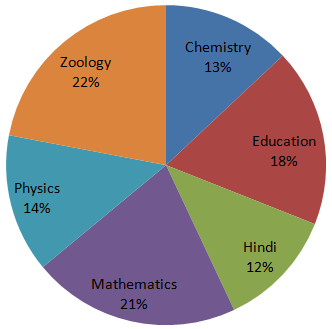
1. Study the following pie-chart and the table given below it carefully to answer the questions given below:
Percentage-wise distribution of lecturers in 6 different subjects in a total number of lecturers: 1600.

Ratio of male to female lecturers
Total number of lecturers (both male and female) in Hindi is approximately what percent of the total number of female lecturers in Mathematics and chemistry together?
Percentage-wise distribution of lecturers in 6 different subjects in a total number of lecturers: 1600.

Ratio of male to female lecturers
| Lecturers | Males : Females |
| Mathematics | 3 : 4 |
| Education | 5 : 3 |
| Hindi | 1 : 3 |
| Chemistry | 1 : 7 |
| Physics | 9 : 5 |
| Zoology | 7 : 9 |
Total number of lecturers (both male and female) in Hindi is approximately what percent of the total number of female lecturers in Mathematics and chemistry together?
Solution:
Number of lecturers in various subjects are:| Subject | Number of Males | Number of Females |
| Chemistry | 208 × = 26 | 208 - 26 = 182 |
| Education | 288 × = 180 | 288 - 180 = 108 |
| Hindi | 192 × = 48 | 192 - 48 = 144 |
| Mathematics | 336 × = 144 | 336 - 144 = 192 |
| Physics | 224 × = 144 | 224 - 144 = 80 |
| Zoology | 352 × = 154 | 352 - 154 = 198 |