Home > Practice > Data Interpretation > Pie Chart > Miscellaneous
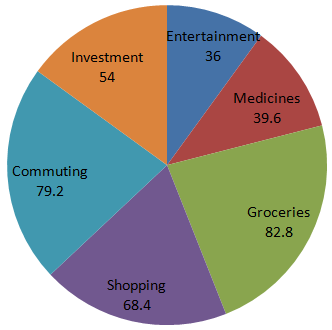
1. Study the following pie-chart carefully and answer the questions that follow:
Degreewise Break-up of Expenditure of a Family in a month
Total Amount Spent In a Month = Rs. 45800.

What is the ratio of the amount spent by the family on medicine to the amount spent on groceries?
(Amount spent on medicine) : (Amount spent on groceries)
Degreewise Break-up of Expenditure of a Family in a month
Total Amount Spent In a Month = Rs. 45800.

What is the ratio of the amount spent by the family on medicine to the amount spent on groceries?
Solution:
Percentage Break-up of expenditure is:(Amount spent on medicine) : (Amount spent on groceries)