Home > Practice > Data Interpretation > Pie Chart > Miscellaneous
1. Study the following pie-charts carefully and answer the questions that follow:
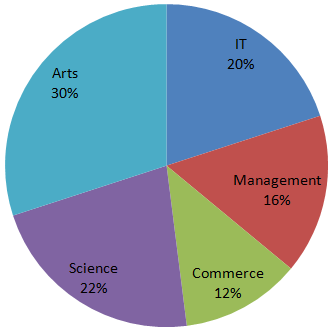
Percentage of Students Enrolled in Different Streams in a College.
Total Number of Students = 3500.

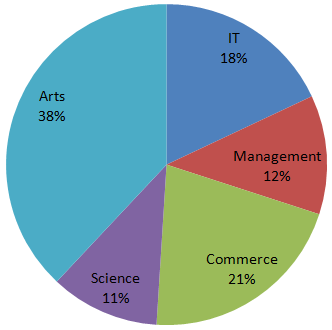
Percentage Break-up of Girls Enrolled in These Streams Out of The Total Students.
Total Number of Girls = 1500.

What is the ratio of the number of girls enrolled in Arts to the number of boys enrolled in Science?
Number of girls enrolled in various streams:
(Number of girls enrolled in Arts) : (Number of boys enrolled in Science)
= 570 : (770 - 165)
= 570 : 605
= 114 : 121
Percentage of Students Enrolled in Different Streams in a College.
Total Number of Students = 3500.

Percentage Break-up of Girls Enrolled in These Streams Out of The Total Students.
Total Number of Girls = 1500.

What is the ratio of the number of girls enrolled in Arts to the number of boys enrolled in Science?
Solution:
Number of students enrolled in various streams:Number of girls enrolled in various streams:
(Number of girls enrolled in Arts) : (Number of boys enrolled in Science)
= 570 : (770 - 165)
= 570 : 605
= 114 : 121