Home > Practice > Data Interpretation > Bar Graphs > Miscellaneous
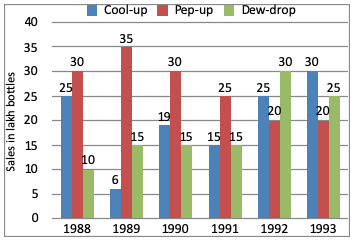
1. Study the graph and answer the questions.

In case of which soft drink was the average annual sale maximum during the period 1988-1993?
Cool up

In case of which soft drink was the average annual sale maximum during the period 1988-1993?
Solution:
Average annual sales during 1988 - 1993Cool up