Home > Practice > Data Interpretation > Bar Graphs > Miscellaneous
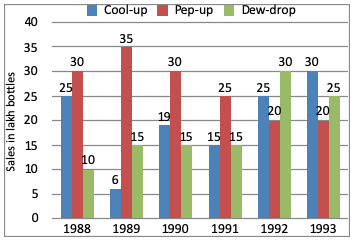
1. Study the graph and answer the questions.

In which year sale of Dew-drop is maximum?

In which year sale of Dew-drop is maximum?
Solution:
Sales of dew drop in 1992 = 30 lakh bottles