Home > Practice > Data Interpretation > Bar Graphs > Miscellaneous
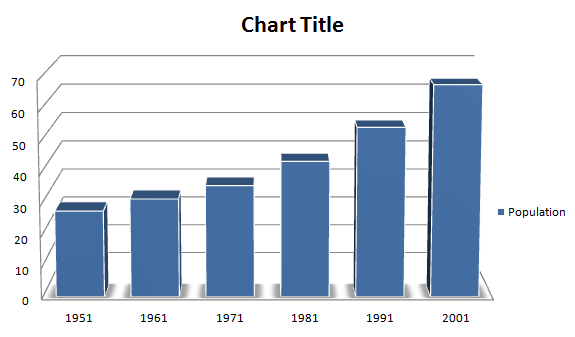
1. Study the graph and answer the questions:
The bar chart give

Per year increase in population from the year 1951 to 2001 is
= 68.40 - 27.90
= 40.5 crores
Hence, annual increase
The bar chart give

Per year increase in population from the year 1951 to 2001 is
Solution:
Total increase= 68.40 - 27.90
= 40.5 crores
Hence, annual increase