Home > Practice > Data Interpretation > Bar Graphs > Miscellaneous
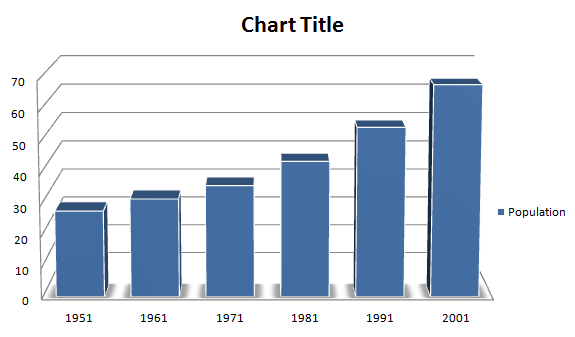
1. Study the graph and answer the questions:
The bar chart give

In which census year, the per cent increase in population is highest as compared to that in the previous census year?
The bar chart give

In which census year, the per cent increase in population is highest as compared to that in the previous census year?
Solution:
Percentage increase in 2001 = 24.8