Home > Practice > Data Interpretation > Pie Chart > Miscellaneous
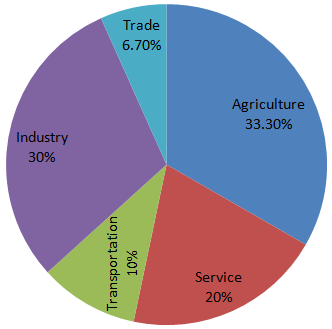
1. Study the pie- chart carefully and answer the questions. The pie- chart represents the percentage of people involved in various occupations.
Total number of people = 20000.

How many more people are involved in service than in trade?
= 20% - 6.70%
= 13.3%
= × 20000
= 2660
Total number of people = 20000.

How many more people are involved in service than in trade?
Solution:
People in service sector more than trade= 20% - 6.70%
= 13.3%
= × 20000
= 2660