Home > Practice > Data Interpretation > Tabulation > Miscellaneous
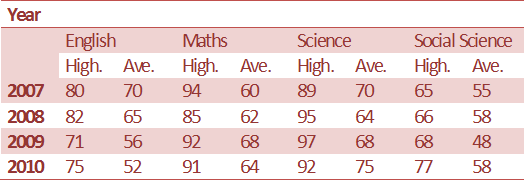
1. Study the table and answer the questions:
The table given here

In which year, the difference between the highest and the average marks in Maths was maximum?
The table given here

In which year, the difference between the highest and the average marks in Maths was maximum?
Solution:
Difference in 2007 is 34 which is maximum.