Home > Practice > Data Interpretation > Bar Graphs > Miscellaneous
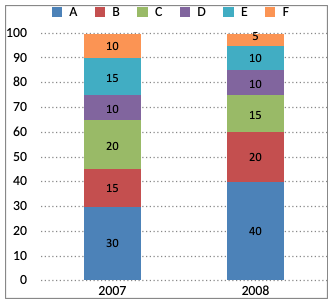
1. The bar chart given below shows the percentage distribution of the production of various models of a mobile manufacturing company in 2007 and 2008. The total production in 2007 was 35 lakh mobile phones and in 2008 the production was 44 lakh. Study the chart and answer the following questions.
Percentage of six different types of mobiles manufactured by a company over two year.

If 85% of the D type mobile produced in each year were sold by the company, how many D type mobiles remained unsold?
= 35 ×
'D' type production in 2008
= 44 ×
Required Answer
Percentage of six different types of mobiles manufactured by a company over two year.

If 85% of the D type mobile produced in each year were sold by the company, how many D type mobiles remained unsold?
Solution:
'D' type production in 2007= 35 ×
'D' type production in 2008
= 44 ×
Required Answer