Home > Practice > Data Interpretation > Bar Graphs > Miscellaneous
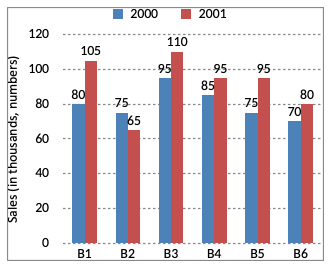
1. The bar graph given below shows the sales of books (in thousand numbers from six branches of a publishing company during two consecutive years 2000 and 2001. Sales of books (in thousands numbers) from six branches B1, B2, B3, B4, B5 and B6 of a publishing company in 2000 and 2001.

Total sales of branch B6 for both the years is what percent of the total sales of branch B3 for both the years?
= 70 + 80
= 150
Total sales of branch B3 for both years
= 95 + 110
= 205
∴ Required percentage
=
= 73.17%

Total sales of branch B6 for both the years is what percent of the total sales of branch B3 for both the years?
Solution:
Total sales of branch B6 for both years= 70 + 80
= 150
Total sales of branch B3 for both years
= 95 + 110
= 205
∴ Required percentage
=
= 73.17%