Home > Practice > Data Interpretation > Bar Graphs > Miscellaneous
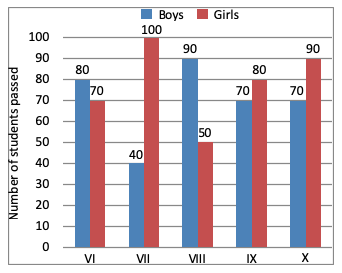
1. The bar graph shows the results of an annual examination in a secondary school in a certain year. Answer the following four questions based on this chart.

The ratio of the total number of boys passed to the total number of girls passed in the three classes VII, VIII and IX is:

The ratio of the total number of boys passed to the total number of girls passed in the three classes VII, VIII and IX is:
Solution: