Home > Practice > Data Interpretation > Bar Graphs > Miscellaneous
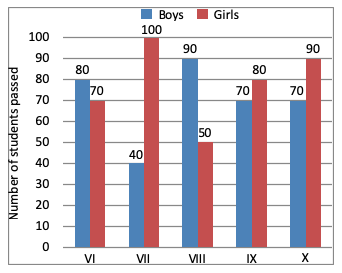
1. The bar graph shows the results of an annual examination in a secondary school in a certain year. Answer the following four questions based on this chart.

The average number of boys passed per class per class is:
= 80 + 40 + 90 + 70 + 70
= 350
∴ Average = = 70

The average number of boys passed per class per class is:
Solution:
Total numbers of boys= 80 + 40 + 90 + 70 + 70
= 350
∴ Average = = 70