Home > Practice > Data Interpretation > Bar Graphs > Miscellaneous
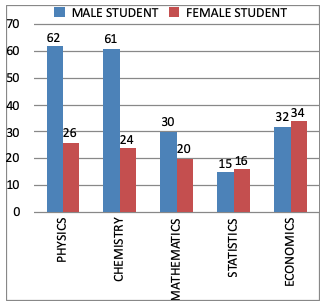
1. The data given in bar diagram relate to the department wise admission of 320 students to B Sc. (Honors) first year classes of a certain college in the given five subjects. Study the graph and answer the questions.

The subject which the female student are finding difficult as compared to other subject is:
Maximum number of female students is difficulty in Statistics.

The subject which the female student are finding difficult as compared to other subject is:
Solution:
If is clear from graphMaximum number of female students is difficulty in Statistics.