Home > Practice > Data Interpretation > Bar Graphs > Miscellaneous
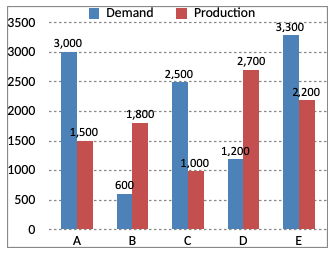
1. The following chart represents Demand and Production for 5 companies ABCDE. On the basis of the graph answer the questions.

If x% of demand for company C equals demand for company B, then x equals.

If x% of demand for company C equals demand for company B, then x equals.
Solution:
Given % of demand for company C = Demand for company B