Home > Practice > Data Interpretation > Bar Graphs > Miscellaneous
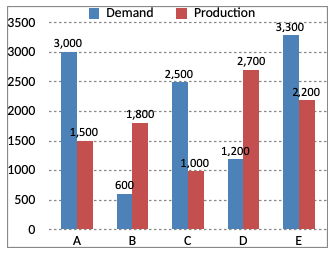
1. The following chart represents Demand and Production for 5 companies ABCDE. On the basis of the graph answer the questions.

If company A desires to meet the demand by purchasing surplus production of company, then the most suitable company is -
= 3000 - 1500
= 1500
Difference between production and demand of company D
= 2700 - 1200
= 1500

If company A desires to meet the demand by purchasing surplus production of company, then the most suitable company is -
Solution:
Difference between demand and production of company A= 3000 - 1500
= 1500
Difference between production and demand of company D
= 2700 - 1200
= 1500