Home > Practice > Data Interpretation > Bar Graphs > Miscellaneous
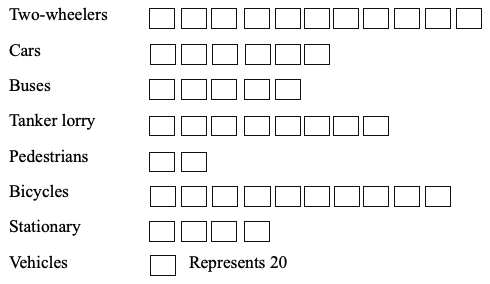
1. The following is a horizontal bar diagram showing the accidents in which two-wheelers are involved with other objects. Study the diagram and answer the questions.
OBJECTS HIT

If the data of the bar diagram is represented by a pie-chart, and the angle of a sector of the pie-chart is 36°, then this sector represents the accidents involving.
It is the accidents of Stationary vehicles
OBJECTS HIT

If the data of the bar diagram is represented by a pie-chart, and the angle of a sector of the pie-chart is 36°, then this sector represents the accidents involving.
Solution:
It is the accidents of Stationary vehicles