Home > Practice > Data Interpretation > Bar Graphs > Miscellaneous
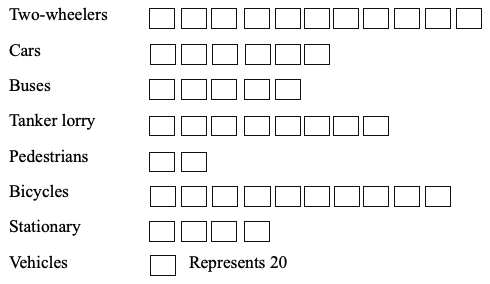
1. The following is a horizontal bar diagram showing the accidents in which two-wheelers are involved with other objects. Study the diagram and answer the questions.
OBJECTS HIT

The percentage by which the accidents involving buses is less than the accidents involving tanker lorry is-
= × 100
= 4%
OBJECTS HIT

The percentage by which the accidents involving buses is less than the accidents involving tanker lorry is-
Solution:
Required difference= × 100
= 4%