Home > Practice > Data Interpretation > Bar Graphs > Miscellaneous
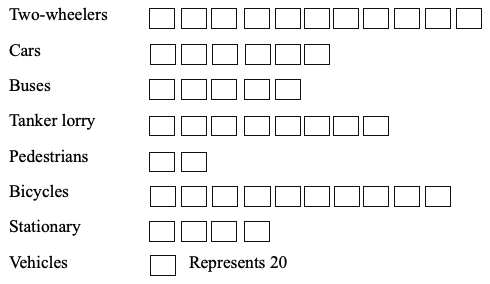
1. The following is a horizontal bar diagram showing the accidents in which two-wheelers are involved with other objects. Study the diagram and answer the questions.
OBJECTS HIT

60% of the accidents are involved due to
= 230 + 150 + 120 + 100
= 600
∴ × 100 = 60%
OBJECTS HIT

60% of the accidents are involved due to
Solution:
Two wheelers + Cars + Buses + Stationary vehicles= 230 + 150 + 120 + 100
= 600
∴ × 100 = 60%