Home > Practice > Data Interpretation > Pie Chart > Miscellaneous
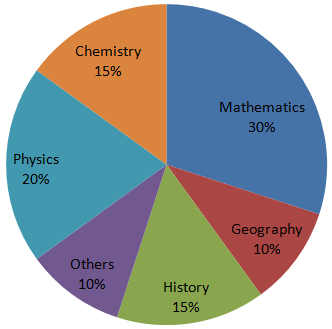
1. The following pie- chart shows the study- time of different subject of a student in a day. Study the pie chart and answer the following questions.

If then student studies chemistry for 3 hours, then he/she studies geography for:
Time spend in G = 10%
∵ 15% = 3H
∴ 10% = × 10 = 2 hours

If then student studies chemistry for 3 hours, then he/she studies geography for:
Solution:
Time spend in C = 15%Time spend in G = 10%
∵ 15% = 3H
∴ 10% = × 10 = 2 hours