Home > Practice > Data Interpretation > Tabulation > Miscellaneous
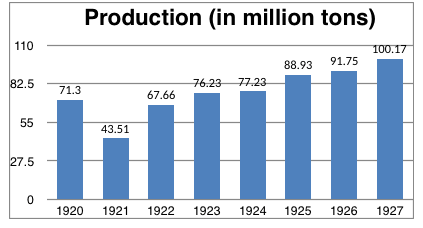
1. The following table show the world production of steel in 1920 - 1927. Study the table and answer the questions.

The number of years during which the company has its production less than the average production during 1920 - 1927 is approximately.
= 77.0975 (million tons)
The required number of year
= 4 (1920, 1921, 1922, 1923)
| Year | Production (in million tons) |
| 1920 | 71.30 |
| 1921 | 43.51 |
| 1922 | 67.66 |
| 1923 | 76.23 |
| 1924 | 77.23 |
| 1925 | 88.93 |
| 1926 | 91.75 |
| 1927 | 100.17 |

The number of years during which the company has its production less than the average production during 1920 - 1927 is approximately.
Solution:
The average production during (1920 - 1927)= 77.0975 (million tons)
The required number of year
= 4 (1920, 1921, 1922, 1923)