Home > Practice > Data Interpretation > Bar Graphs > Miscellaneous
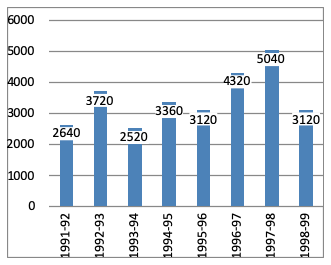
1. The graph shows the exchange reserve of a country in difference years. Study the graph and answer the questions.

The ratio of number of years, in which the foreign exchange reserves are above the average reserves, to those in which the reserves are below the average reserves is:
Note :
Years in which the foreign exchange reserves are above the average reserves = 1992-93, 1996-97, 1997-98 = 3 years
Years in which the foreign exchange reserves are below the average reserves = 1991-92, 1993-94, 1994-95, 1995-1996, 1998-1999 = 5 years

The ratio of number of years, in which the foreign exchange reserves are above the average reserves, to those in which the reserves are below the average reserves is:
Solution:
Average reservesNote :
Years in which the foreign exchange reserves are above the average reserves = 1992-93, 1996-97, 1997-98 = 3 years
Years in which the foreign exchange reserves are below the average reserves = 1991-92, 1993-94, 1994-95, 1995-1996, 1998-1999 = 5 years