Home > Practice > Data Interpretation > Bar Graphs > Miscellaneous
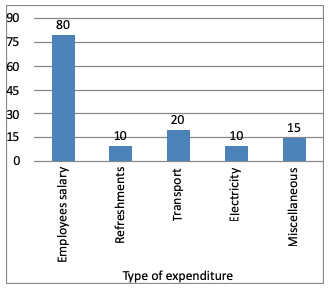
1. The graph shows the monthly expenditure of a company ( unit = 10 lakh). Study the graph and answer the questions.

The percentage of money spent on miscellaneous is:

The percentage of money spent on miscellaneous is:
Solution: