Home > Practice > Data Interpretation > Bar Graphs > Miscellaneous
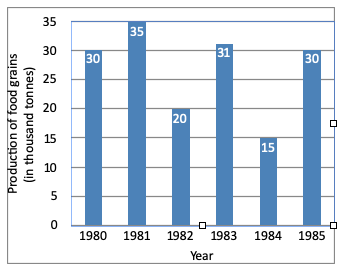
1. The graph shows the production of food grains of a country in different. Study the graph and answer the questions.

The difference of the production of food grains for the year 1981 and 1985 is:
= 35 - 30
= 5 × 1000
= 5000 tonnes

The difference of the production of food grains for the year 1981 and 1985 is:
Solution:
Difference of production of 1981 and 1985= 35 - 30
= 5 × 1000
= 5000 tonnes