Home > Practice > Data Interpretation > Bar Graphs > Miscellaneous
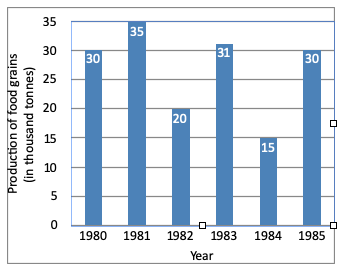
1. The graph shows the production of food grains of a country in different. Study the graph and answer the questions.

The percentage increase in production from 1984 to 1985 was.

The percentage increase in production from 1984 to 1985 was.
Solution: